Cashflow Score by Cladfy Inc.
A lender's guide to an AI-powered default prediction score.
What is the Cashflow Score?
The Cashflow Score is an AI-powered default prediction score delivered through the CashIQ platform by Cladfy Inc. It is not a credit bureau score; it does not access CRB data, credit reports, or traditional credit histories.
Instead, it analyzes only the transaction data available, M-PESA statements, bank statements, and other mobile money data (e.g., MTN MoMo, Airtel Money) to predict the likelihood that a borrower will default on a loan. The score ranges from 300 to 850, where higher scores indicate lower default risk.
The engine uses a proprietary multi-pillar analysis framework adapted specifically for cashflow patterns across African mobile money and banking markets. The accuracy of the score is directly tied to the volume and quality of transaction data provided.
Five Credit Pillars
Every score is built from five independently weighted pillars that assess default risk from different angles:
| Pillar | What It Measures |
|---|---|
| Income & Capacity | Can they repay? Monthly earnings, formal income sources, disposable income buffer |
| Cash Flow Stability | Are they consistent? Transaction regularity, income trends, and financial network depth |
| Debt Burden & Leverage | How exposed are they? Overdraft usage, multi-lender exposure, spending rate vs income |
| Repayment Behavior | Do they pay back? Verified repayment rates, overdraft discipline, escalation patterns |
| Financial Sophistication | How mature are they? Savings habits, insurance, essential vs discretionary spending |
The engine also applies cross-pillar interaction adjustments; consistent strength is rewarded, while critical weakness in any pillar triggers compounding penalties. For example, low income combined with heavy debt is penalized more harshly than either alone.
What Data Goes In
The engine consumes all available financial data as a combined input: M-PESA statements, bank statements, and other mobile money platforms (e.g., MTN MoMo, Airtel Money) when available. The more data sources provided, the more accurate and comprehensive the score.
Beyond raw transaction data, the CashIQ platform extracts deeper financial signals that are invisible in transaction records alone:
| Enriched Capability | Why It Matters for Default Reduction |
|---|---|
| Disposable income | The #1 affordability signal that measures the actual repayment buffer after expenses |
| Income volatility & trend | Catches borrowers with declining or erratic income before they default |
| Verified repayment rate | Ground-truth repaid ÷ taken across all lenders, not estimates |
| Zero-balance frequency | A leading stress indicator accounts for those that regularly hit zero, which are high-risk |
| Overdraft dependency | Covers all overdraft products, not just individual providers |
| Net cashflow trend | Detects deteriorating monthly (income − expenses) trajectory |
| Debt service coverage | "Can they afford the next payment?" Disposable income vs monthly obligations |
| Savings & SACCO activity | Active savers and SACCO members default at significantly lower rates |
| Gambling detection | Heavy gambling spending relative to income triggers proportional risk penalties |
| Transaction history depth | Applicants with a thin history receive capped scores until trust is established |
| Discretionary spending ratio | High entertainment/airtime spend vs income flags financial indiscipline |
Every enriched field is optional. The engine uses whatever is available and falls back gracefully. Even a single enriched field improves accuracy.
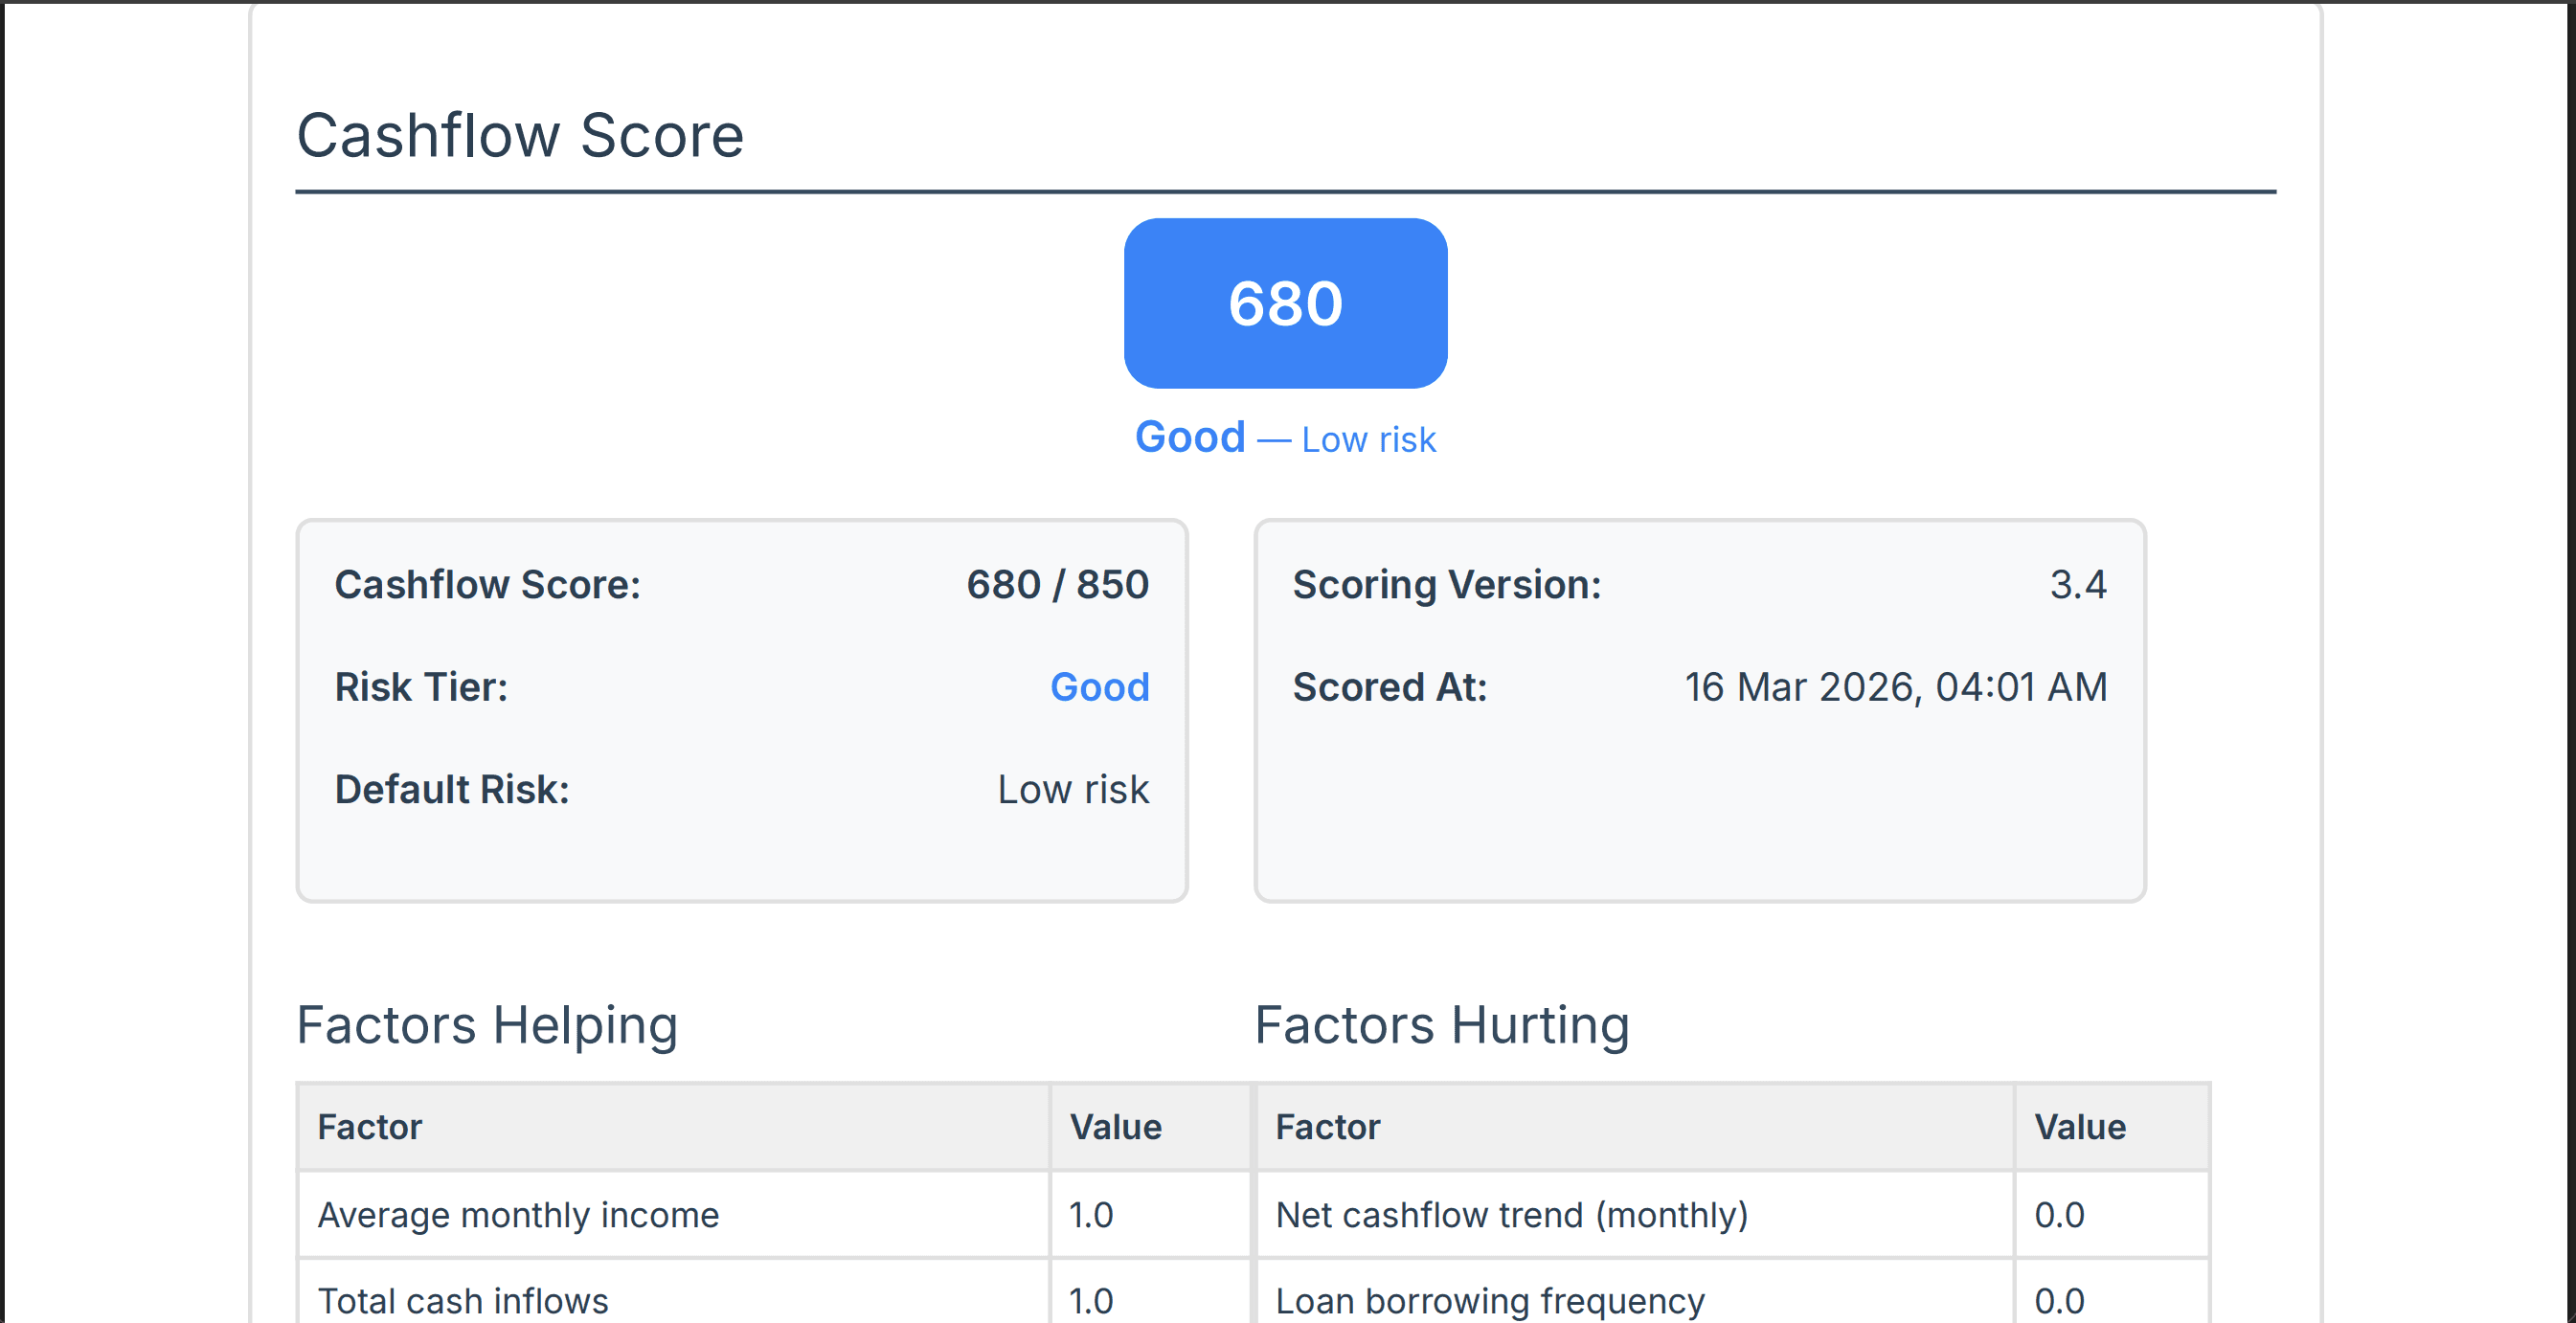
Risk Tiers
| Score Range | Tier | Default Risk | Suggested Action |
|---|---|---|---|
| 780–850 | Excellent | Very low | Pre-approved, best rates |
| 680–779 | Good | Low | Standard approval |
| 560–679 | Fair | Moderate | Conditional approval, reduced limits |
| 400–559 | Poor | High | Enhanced due diligence |
| 300–399 | Very Poor | Very high | Decline or micro-loan only |
Built-in Safeguards
| Safeguard | How It Protects Lenders |
|---|---|
| Data sufficiency gate | Applicants with little or no transaction data receive 300 (data_sufficient: false). The score only reflects what the data supports; no assumptions are made beyond available transactions. |
| Thin-file score cap | Short transaction history = capped maximum score. Trust is earned over time. |
| Gambling cross-pillar penalty | Heavy gambling impact extends beyond a single pillar; it can meaningfully reduce the final score |
| Income decline emergency brake | Sharply declining income triggers additional penalties even if other pillars look healthy |
| Spending rate detection | Applicants spending nearly all of their income are flagged; no buffer = high default risk |
| Deduplication engine | When multiple data sources contain overlapping information, the engine automatically uses the most accurate source and prevents double-counting |
Explainable Scoring : top_factors
Every response includes helping and hurting factors that explain the score in plain language:
"top_factors": {
  "helping": [
    {"signal": "monthly_income", "label": "Average monthly income", "value": "XX.XX"},
    {"signal": "savings_behavior", "label": "Savings activity", "value": "XX.XX"},
    {"signal": "exact_repayment_rate", "label": "Verified loan repayment rate", "value": "XX.XX"}
  ],
  "hurting": [
    {"signal": "gambling_penalty", "label": "Gambling activity risk", "value": "XX.XX"},
    {"signal": "zero_balance_rate", "label": "Zero-balance frequency", "value": "XX.XX"},
    {"signal": "spending_rate", "label": "Spending rate vs income", "value": "XX.XX"}
  ]
}
value: 0.0 (worst) to 1.0 (best) for each signalHelping: the applicant's strongest credit signals
Hurting: where they're weakest; and what they'd need to improve
Use this for:
Underwriter review: quick insight into why a borderline applicant scored where they did
Applicant feedback: actionable guidance ("reducing your overdraft usage would improve your score")
Audit trail: full signal-level transparency
API Integration
Example
API Request
{
  "overview": {
    "mpesa_transaction_count": "XX.XX",
    "paid_in_average_pm": "XX.XX",
    "loan_dependency_ratio": "XX.XX"
  },
  "data": {
    "summary": {
      "loans_taken_count": "XX.XX",
      "loans_repaid_count": "XX.XX",
      "zero_balance_rate_percentage": "XX.XX"
    },
    "cashflow": {
      "monthly": [
        {"month": "Period", "total_in": "XX.XX", "total_out": "XX.XX"},
        {"month": "Period", "total_in": "XX.XX", "total_out": "XX.XX"}
      ],
      "averages": {"avg_monthly_in": "XX.XX", "avg_monthly_out": "XX.XX"}
    },
    "savings": {"details": {"total_amount": "XX.XX", "total_transactions": "XX.XX"}},
    "gambling": {"overview": {"total_amount": "XX.XX", "total_transactions": "XX.XX"}},
    "disposable_income": {
      "last_3months_disposable_income": [
        {"month": "Period", "amount": "XX.XX"},
        {"month": "Period", "amount": "XX.XX"},
        {"month": "Period", "amount": "XX.XX"}
      ]
    }
  }
}
API Response
{
  "request_id": "a1b2c3d4-...",
  "prediction": "XX.XX",
  "probability": "XX.XX",
  "score": "XX.XX",
  "risk_tier": {
    "tier": "Tier",
    "min_score": "XX.XX"
  },
  "top_factors": { "helping": [...], "hurting": [...] },
  "pillars": {
    "income_capacity":          {"label": "Income & Capacity",          "score": "XX.XX"},
    "cashflow_stability":       {"label": "Cash Flow Stability",        "score": "XX.XX"},
    "debt_leverage":            {"label": "Debt Burden & Leverage",     "score": "XX.XX"},
    "repayment_behavior":       {"label": "Repayment Behavior",         "score": "XX.XX"},
    "financial_sophistication": {"label": "Financial Sophistication",   "score": "XX.XX"}
  },
  "data_sufficient": "true/False",
  "enriched_data_available": "true/False",
  "scoring_version": "XX.XX",
  "latency_ms": "XX.XX"
}
| Field | Description |
|---|---|
score |
Final Cashflow Score (300–850) |
risk_tier |
Tier label and threshold |
top_factors |
Helping and hurting signals explaining the score |
pillars |
Per-pillar score breakdown (0.0–1.0 each) |
data_sufficient |
Whether enough data existed for meaningful scoring |
enriched_data_available |
Whether enriched data was provided |
latency_ms |
Processing time in milliseconds |
How the Score Is Produced
The engine uses a proprietary two-stage architecture:
Machine Learning Model: A trained model processes the available transaction data to produce a default probability.
Multi-Pillar Analysis: The probability is combined with proprietary signal analysis across all five pillars, cross-pillar interactions, and calibration curves to produce the final score.
Design principles:
✅ Transaction-data only, no CRB, no credit bureau, no external data beyond provided statements
✅ Multi-source, M-PESA, bank statements, and other mobile money data combined for maximum accuracy
✅ Data-limited, the score only reflects what the available transaction data supports
✅ Deduplicated, overlapping data sources are automatically resolved to prevent double-counting
✅ Deterministic, same input always produces the same score
✅ Calibrated, score distribution maps to real-world default rates
✅ Transparent, full signal-level explainability for every decision
Frequently Asked Questions
How should I use
top_factors? Helping factors explain why a score is high; hurting factors explain why it isn't higher. Share with applicants as actionable feedback or use for underwriter review of borderline cases.Is the score deterministic? Yes. Identical input always produces an identical score. No randomness.
How does deduplication work? When multiple data sources contain overlapping information, the engine automatically uses the most accurate source and disregards the duplicate. This prevents unfair double-counting.
What about applicants with a very short history? The engine applies a thin-file score cap to applicants with limited transaction history, who can only achieve a limited maximum score until more data becomes available.
How does gambling affect the score? Proportionally. Occasional small amounts have minimal impact. Gambling exceeding a significant portion of income triggers a meaningful penalty that affects the overall score, not just one pillar.
How often should I re-score a borrower? Re-score whenever you have a new or updated statement. For existing borrowers, a quarterly re-score using the latest 6-month statement provides good monitoring coverage.